cardiac mr
Comprehensive, fast, accurate reading and reporting for cardiac MR
cvi42’s Cardiac MR offering is a one stop shop for all your clinical CMR needs. Quantify cardiac function, flow and assess tissue abnormalities faster than ever before with AI-based contouring.
Function
Increase scanning throughput for myocardial function with quick ejection fraction, stroke volume and mass calculations. Reduce manual workload with accurate and reproducible volumetric assessment for all cardiac chambers.
SAX
- Server-side pre-processing of function contours
- AI-based left and right ventricular contour detection
- User friendly editing tools
- Polar map display for LV wall thickening and motion
Biplanar LAX
- AI-based LV, LA and RA contour detection in all phases
- Automatically calculated long axis strain values
Radial Long Axis
- Quick and highly reproducible LV assessment with an axial acquisition
- Semi-automated contour detection
Applications
- Heart Failure
- Ischemic Heart Disease
- Myocardial Infarction/Scar
- Cardiomyopathies
- Myocarditis
- Valvular Heart Disease
- Cardiac Mass
- Pericardial Disease
- Atrial Fibrillation
Flow
Produce flow information for the evaluation of systolic and diastolic function. Easily quantify shunts, valve regurgitation and compare multiple vessels.
Flow 2D
- Server-side pre-processing of flow contours
- AI-based aortic and pulmonary contour detection
- Qp:Qs comparison
- Apply offset and anti-aliasing correction
Applications
- Heart Failure
- Cardiomyopathies
- Thoracic Aortic Disease
- Valvular Heart Disease
- Congenital Heart Disease
Tissue
Signal intensity, T1 Mapping and perfusion analysis involving images acquired with contrast agents are only available for non-clinical use in USA.
Effectively evaluate characteristics of myocardial tissue to inform diagnostic decision making for ischemic and non-ischemic diseases. Quantify enhancement, edema, perfusion defects and iron load from simple acquisition sequences.
Signal Intensity
- Calculate scar and edema percentage with late enhancement and T2 weighted imaging
- AI-based contour detection
- Multiple algorithm options for quantifying scar pattern presentations
T1 Mapping
- Motion correction of T1 raw images
- Native and post-contrast T1 and ECV map generation and customizable color maps
- Automated loading and AI-based contour detection of native and post-contrast maps
- Global and regional analysis
T2 Mapping
- Motion correction of T2 raw images
- T2 map generation and customizable color maps
- Automated loading and AI-based contour detection of T2 map
- Global and regional analysis
T2* Mapping
- Global and regional T2* analysis
- T2* color overlay
- Reporting of iron content
Semi-quantitative Perfusion
- Qualitative viewer for rest and stress imaging
- Polar map and curve display for signal intensity
Applications
- Heart Failure
- Coronary Artery Disease
- Ischemic Heart Disease
- Myocardial Infarction/Scar
- Cardiomyopathies
- Myocarditis
- Cardiac Mass
- Pericardial Disease
- Atrial Fibrillation
- Thalassemia
- Hemochromatosis
cvi42 | Strain
Additional license required.
Quantify myocardial deformation without additional time in the scanner. Increase sensitivity for detection of mild functional abnormalities in contrast to EF alone.
- Quantify global and regional radial, circumferential and longitudinal strain in 2D
- AI-based LV contour detection
- Calculate strain rate, displacement, time to peak strain and displacement, velocity, torsion, and torsion rate
Advanced Research Tools
- Quantify global and regional radial, circumferential and longitudinal strain in 3D
Research use only in USA.
Applications
- Heart Failure
- Cardiac Mass
cvi42 | 4D Flow
Additional license required.
Visualize and quantify flow patterns anywhere in a 3D structure with AI-automated workflows.
- Auto-loading and auto-contouring, AI-based segmentation of aorta, pulmonary artery and heart chambers.
- Automatically detected peak-velocity planes in the aorta and pulmonary artery for automated Qp/Qs measurement.
- Faster loading times for large studies.
- Preprocessing including offset correction and antialiasing
- Centerline definition for multiple structures
- Various flow visualizations
- Flow assessment in multiple planes Qp:Qs comparison
Advanced Research Tools
- Pulse wave velocity calculation
- Ventricular flow assessment including direct, residual, delayed and retained flow components
- Relative pressure
- Wall Shear Stress
- Energy loss
Research use only in USA.
Applications
- Heart Failure
- Cardiomyopathies
- Thoracic Aortic Disease
- Valvular Heart Disease
- Congenital Heart Disease
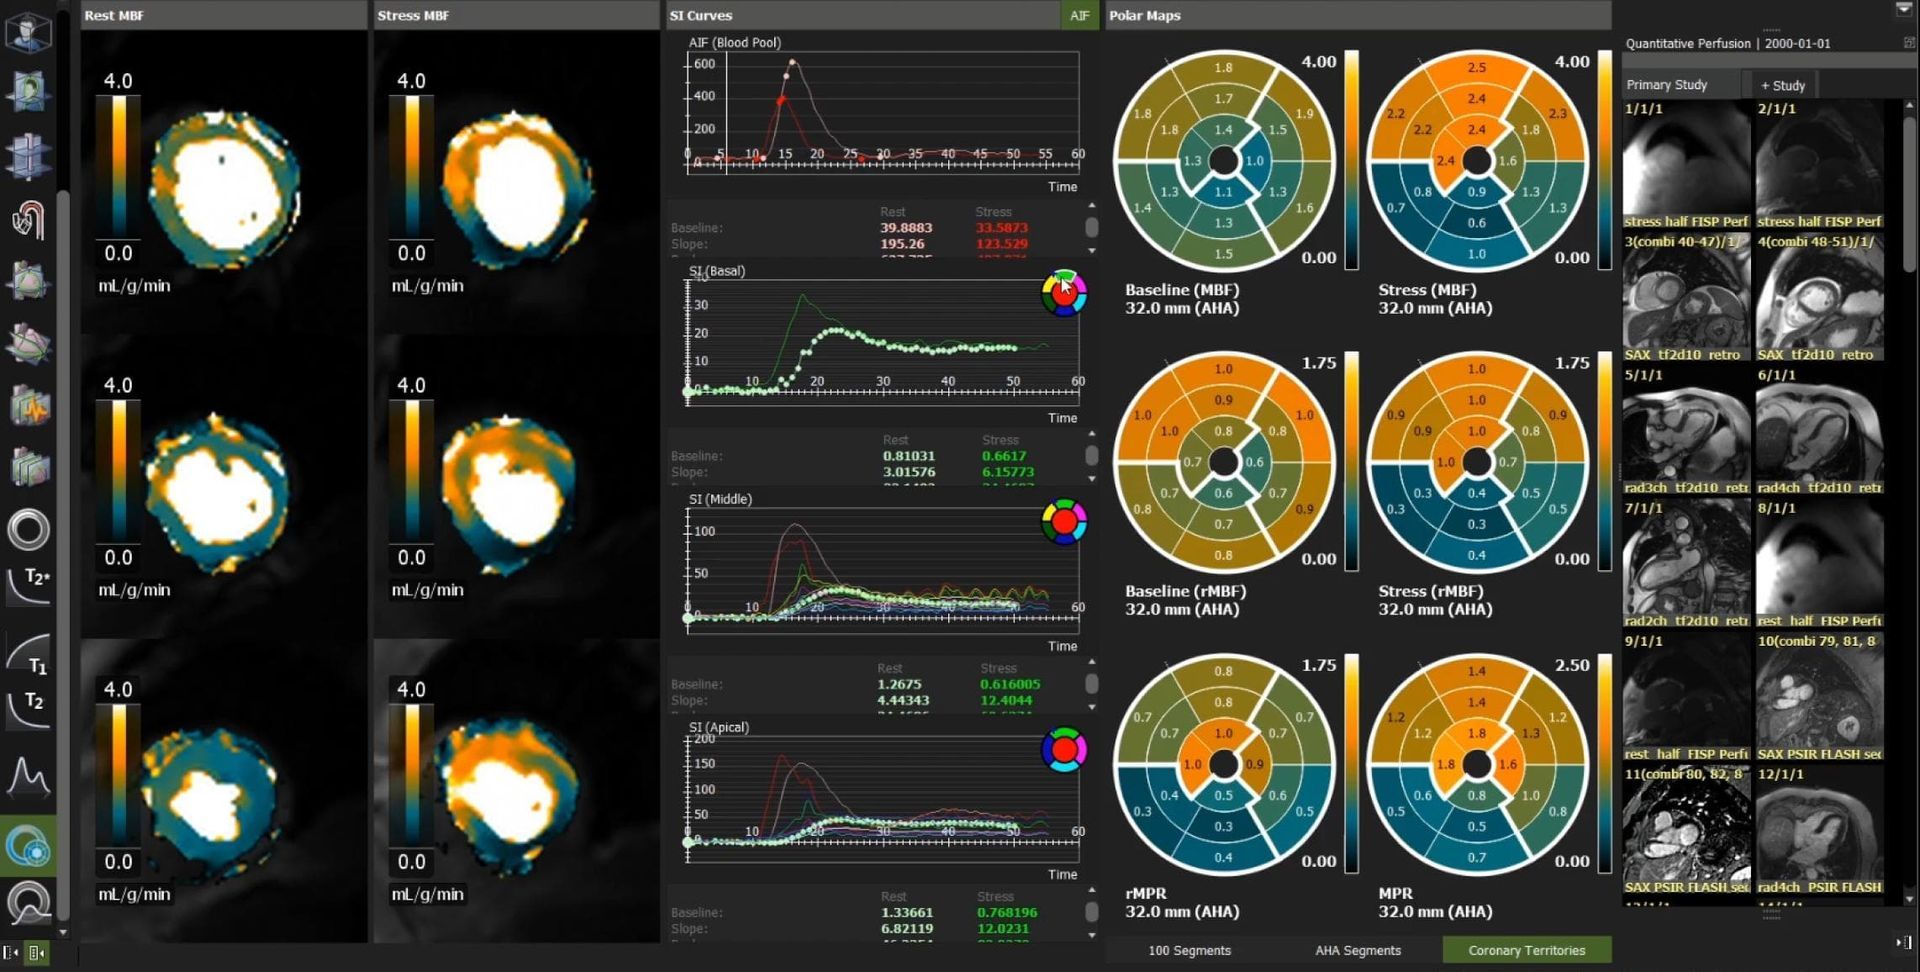
cvi42| Quantitative Perfusion
Additional license required. Research use only.
Intuitively visualize perfusion defects in patients with suspected Coronary Artery Disease (CAD). Quantify myocardial blood flow at rest and stress to reduce intra-reader variability.
- Streamlined workflow for rest and stress perfusion quantification
- Automated motion correction and contour detection
- Color map display of myocardial blood flow (MBF) values
- Color map display of myocardial perfusion reserve (MPR) values
- Vendor neutral with multi-sequence support
Applications
- Ischemic Heart Disease
- Myocardial Infarction/Scar
- Cardiomyopathies
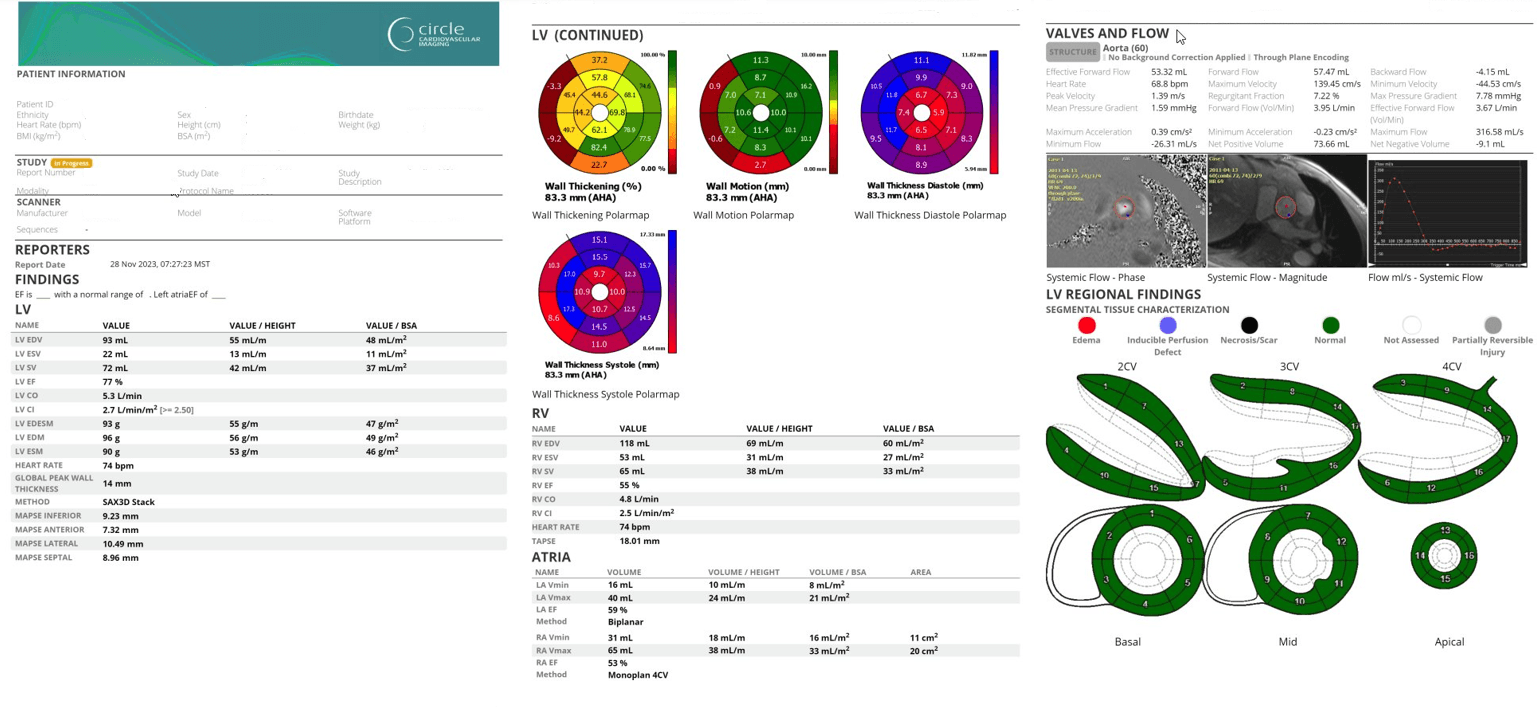
Reporting
cvi42 offers customizable structured reporting for cardiac MR evaluation. Build the report you need for research and daily clinical practice.
Standard Integrated Report
- Simple Clinical and Scientific data reporting
- Customizable template builder
- Infographics, diagrams, screenshots and measurements
- Export PDF, text, DICOM secondary capture and DICOM encapsulated pdf
- User configurable normal values and automatic classification
- Updated normal values sourced from the Healthy Hearts Consortium*
- Configure consistent findings text including values and results
- User permissions configuration
- DICOM SR support
*https://www.jacc.org/doi/10.1016/j.jcmg.2024.01.009
cvi42 | Report
Additional license required. HL7 integration requires the purchase of HL7 Integration Services.
- Includes all standard reporting functionalities
- Z-Scores
- Advanced Database Search
- Browser Access
- HL7 Integration
Web Viewer
Enables viewing study images and editing patient reports from supported web browsers. Access the information you need for an efficient cardiac imaging workflow that works for you.
- Review report and images with referring physicians
- Show patients their images in the exam room
- Improve collaboration across your health care team by reviewing reports easily
Web Viewer MR Functionalities
- Modify SAX function contours and edit/update/finalize reports.
- Quickly view pre-processed MR SAX function results directly in the report.
- Access 2D Flow, Tissue, and LGE contours from pre-analyzed workspaces.
- Smart CMR viewing with series classification and automated view settings to optimize cardiac imaging.
- Apply study tags to organize your cases.
- Add basic measurements (Line, ROI, Arrow).
Why Circle?
Our automated platform increases productivity while streamlining reporting. Reclaim lost time by optimizing decision-making with our cutting-edge AI platform and our unique expertise.

Our Technology Enables Informed Decisions for Fast and Accurate Diagnoses

Automated Workflows Increase Time for Patient Care

Unmatched User Experience & Support You Can Count On
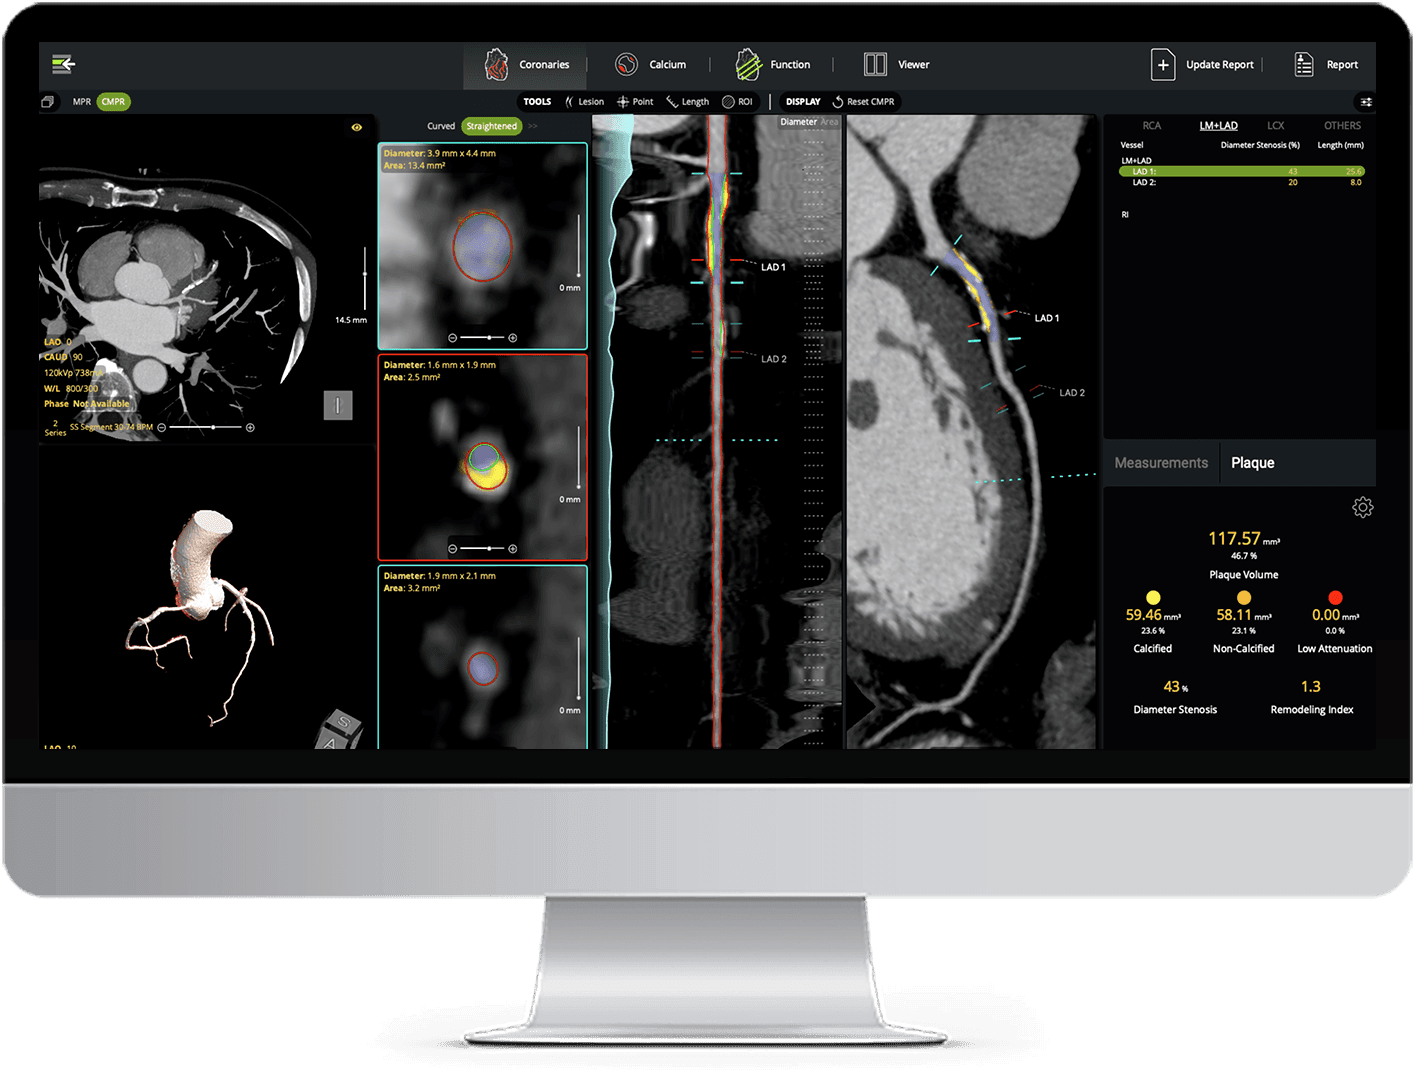
AI Plaque Analysis
AI-powered coronary plaque quantification with detailed reporting - fully interactive and integrated into your CT workflow.